Posts

Showing posts from August, 2023

Data: raw, analysis, and presentation (part I)

Image
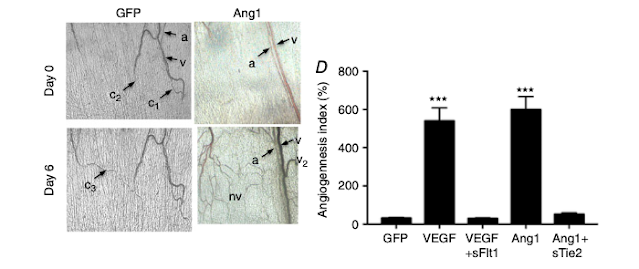
So, what did you find? You've found a research gap and developed a hypothesis 🔍🔎 You've chosen the appropriate study design to test your hypothesis ❌❎ You've collected data from the experiments you conducted 📙📀 And now? The results section is the one that conveys the importance of a manuscript, but the collected unprocessed data is raw. A bunch of numbers, quotes from surveys, or images won't give you any insight 😕 ; not if you don't have a plan for data analysis.   When reporting data, it is important to be clear, brief, and accurate. And remember that the most visually appealing section of the paper must have a polished presentation. 💅 Look at all the pretty pictures and charts! I'll be illustrating the points below using examples from the results section of the research paper by Stone et al . (J Physiol . 2017;595(5):1575-1591. doi:10.1113/JP273430).   Outlining and analysis My academic mentors always asked me to plan out what the figures in a manus

Living under the ROC

Image
To diagnose a condition, physicians often resort to different tests. The performance of each of these diagnostic methods can be measured using different characteristics: Predictive value is the probability of correctly identifying a subject's condition given the test result. ✅ Youden's J is the likelihood of a positive test result in subjects with the condition versus those without the condition — probability of an informed decision . 👀 Sensitivity is the proportion of people who actually have a target disease that are tested positive ( true positive or detection rate ).📍 A negative result in a test with high sensitivity can be useful for ruling out disease, because it has a lower type II error rate. Specificity is the proportion of people who do not have a target disease that are tested negative ( true negative rate ). The false positive rate (1 − specificity) is the probability of false alarm . 🚫 A positive result in a test with high specificity can be useful

Reliability

Image
Reliability is the characteristic of a test or method that produces consistent results, which means the test instrument is unlikely to be influenced by external factors. Validity and reliability are used to assess the rigour of research. A study's quality relies on its ability to produce results that are easily interpreted — as such, several researchers conducting the same experiment using the same test on the same group of participants should be able to produce similar results.   How is this evaluated? Internal consistency : a measure of correlation, not causality . The extent to which all the items on a scale measure one construct or the same latent variable. Depending on the type of test, internal consistency may be measured through Cronbach's alpha , Average Inter-Item , Split-Half , or Kuder-Richardson test .   Example: Visual Analog Scales and Likert Scales. This VAS for pain is presented to participants without the numerical scale (see here ).                          

Biases and bathing suits

Image
It's summer in the northern hemisphere, and I put on a bathing suit today... 😒 How can we tell if we are measuring what we think we are measuring?   From the 1970s , the Body Mass Index (BMI) was adopted by medics as a measure of obesity, but several issues have come to light regarding the use of this tool . As more knowledge has been amassed, the clinical definition of obesity has changed.    Nowadays, the WHO still imparts some face validity to assessing the BMI —because it “looks like” or “appears to” measure what it is intended to measure , although scientists are aware that body fat proportion is a better predictor for the risk of diabetes . 🍕🍎🍔🍓   Correlation between BMI and Body Fat Percentage for Men (NHANES, 1994) For the original study where this graph came from, see here . So, construct validity determines if something “really” measures the construct (in this case, of obesity ), and content validity measures the tool's overall value (in this case, for di

Validity

Image
The aim of scientific research is to produce generalizable knowledge about the real world. An experiment's validity is established in reference to a specific purpose —the test or technique used may not be valid for different purposes. However, scientists are human and fallible. The  illusion of validity describes our tendency to be overconfident in the accuracy of our judgements, specifically in our interpretations and predictions regarding a given data set.   Temporal validity tests the plausibility of research findings over a given time frame. When conducting the same experiment at key points over a period of time, historical events may affect results.  The most recent example of this is the rise in cancer deaths due to untreated or undiagnosed cancers during the COVID-19 mandatory lockdown.   Population validity evaluates whether the chosen sample or cohort represents the entire population, and also whether the sampling method is acceptable. In evidence-based medic