Data: raw, analysis, and presentation (part I)
So, what did you find?
- You've found a research gap and developed a hypothesis 🔍🔎
- You've chosen the appropriate study design to test your hypothesis ❌❎
- You've collected data from the experiments you conducted 📙📀
And now?
The results section is the one that conveys the importance of a manuscript, but the collected unprocessed data is raw. A bunch of numbers, quotes from surveys, or images won't give you any insight 😕; not if you don't have a plan for data analysis.
When reporting data, it is important to be clear, brief, and accurate. And remember that the most visually appealing section of the paper must have a polished presentation. 💅
Outlining and analysis
My academic mentors always asked me to plan out what the figures in a manuscript would look like, as the first step to outlining the story (Thank you Christopher! Thank you Dave!). Consider this the zero draft. Its purpose was to point towards the quality and quantity of data points needed.❗
You may need to clean 🛀, transform💈, or integrate 🗿the data before you can use it. However, it is always a good idea to collect data and store it in a
pre-specified order, as it will enable rapid spotting of missing data
points. 👀
However, the order of data collection may differ from how it should be presented —logically, and in a sequence that demonstrates the effective testing of the central hypothesis. 💡
Visualization
There are 3 main ways to present data:
✒ Tables —enable efficient comparison and evaluation of precise data sets.
✒ Figures —highlight patterns and trends in data.
I'll discuss these on a different post.
Today, let's look at
✒ Text —relates the overall message of a research study.
I'll use the example of one of the most challenging papers for which I had to organize data to uncover its main finding. See the full text here. Quoted text from the paper is in grey.
Headings and subheadings —the results section is often subdivided into microssections, that function as chapters of the overarching story.
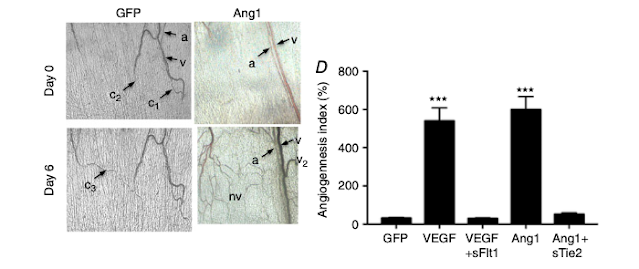
- Soluble receptor overexpression blocks Ad.VEGF- and Ad.Ang1-induced neovascularization
- Nitric oxide-induced neovascularization requires VEGF–VEGFR and Ang–Tie signalling
- The architecture of NO-induced neovascular networks depends upon VEGF–VEGFR and Ang–Tie signalling
- Angiopoietin does not further enhance NO-mediated angiogenesis
- Concomitant NO–Tie signalling stimulates arteriolargenesis
- Endogenous VEGF signalling is essential for NO–Tie arteriolargenesis
We start by confirming biological concepts that were already known (VEGF and Ang1 induce neovascularization), then apply them to a new paradigm (NO induces neovascularization in some instances), but safeguarding all the caveats (the shape of the vascular networks formed by NO depends on VEGF and Ang signalling).
Then we describe the effect of these molecules on a known biological mechanism (angiogenesis), then on a related but different mechanism (arteriolargenesis), to finally highlighting a novel molecular mechanism.
Logical progression —each section should be easy to follow, with comparisons between different conditions building logically one from another.
Staining of vessels for endothelial cells, proliferating endothelial cells and pericytes (Fig. 2A) demonstrated that sFlt1 and sTie2 inhibited, respectively, the VEGF- and Ang1-mediated increase in both vessel density (Fig. 2B) and proliferating endothelial cell density (Fig. 2C). sFlt1 inhibited VEGF-induced sprouting (Fig. 2D) and branching (Fig. 2E), and sFlt1 and sTie2 reversed the effect of VEGF (a reduction relative to control) and Ang1 (an increase relative to control), respectively, on both vessel length (Fig. 2F) and diameter (Fig. 2G). sTie2 also reduced the increased pericyte coverage induced by Ang1 (Fig. 2H).
In this section, each inhibitor (sFlt1 and sTie2) is described in relation to its respective positive control (growth factors VEGF and Ang1).
Then, the effect of these inhibitors on the changes promoted by the growth factors (increase or reduction) relative to the negative control is detailed.
Parallel grammatical structure —it's best to start with easier concepts and build up to more complex ones. This helps with aprehending the main message.
Addition of both Ad.sFlt1 and Ad.sTie2 completely blocked NO-mediated angiogenesis (eNOS+sFlt1+sTie2 compared with eNOS alone, Fig. 8A and B), whereas Ad.sFlt1 reduced by approximately 50% the NO–Tie (eNOS+Ang1)-mediated angiogenesis (Fig. 8B, compared with Fig. 6B). Staining for Ki67 and isolectin B4 (Fig. 8C) confirmed that the vascular density (Fig. 8D), branching (Fig. 8E) and sprouting (Fig. 8F) induced by NO-mediated angiogenesis were completely blocked by combined inhibition of both Ang1 and VEGF. However, while both density and branching induced by NO–Tie-mediated angiogenesis were blocked (Fig. 8D and E), sprouting was not affected (Fig. 8F).
In this section, the synergistic effect of the inhibitors (sFlt1 + sTie2) is first described in relation to a single test molecule (eNOS) and then in relation to a combination of test molecules (eNOS + Ang1).
Note that the main morphological parameters chosen to measure angiogenesis (vessel density, branching, and sprouting) were also described in the paragraph above.
This is the section of your paper where all the effort you've put into the research is uncovered. You want the overall message to be understood as well as the nitty-gritty.
Consistency is key for clarity.


Comments
Post a Comment