Data is what we live for... but its presentation is critical for clear understanding.
First state the general parameters, then get specific. Give the readers an idea of the representativeness of the
research data, then state key findings and relevant analyses.
Choosing the appropriate format for reporting research results is essential. If data are presented in a figure or table, there is no need to repeat these in the text.
Qualitative research (such as surveys and interviews) generates textual data 🔡 that can be presented in a table (or matrix) format.
Tables
✒ Tables are generally used to present large amounts of numerical information. 📋
✒ Table titles are placed above the table.
✒ Columns and rows within tables also require clear headings: this usually means that demographic characteristics (such as age, sex, or race) are listed in rows, while columns are used to divide participants per treatment group, and present relevant comparisons.
✒ For the table to be meaningful on its own, extra care should be provided to specify units of measure, round off long numbers, and limit
decimal places. 🔢
✒ Moreover, an uncluttered table is an effective table. The definition of any nonstandard abbreviations,
unusual symbols 🔣, and specialised terms should be left to the footnotes.
Figures
✒ Graphics are particularly good for demonstrating a trend in the data
that would not be apparent in tables, providing visual emphasis, and
avoiding lengthy text descriptions. 💹
✒ Figures must be accompanied by a caption (or legend), which is a brief description of the contents of the figure. The caption explains how to read the figure and provides additional precision for what cannot be graphically represented. 📅
✒ Bar charts, either horizontal or column bars, are used to display categorical data. 📊
 |
|
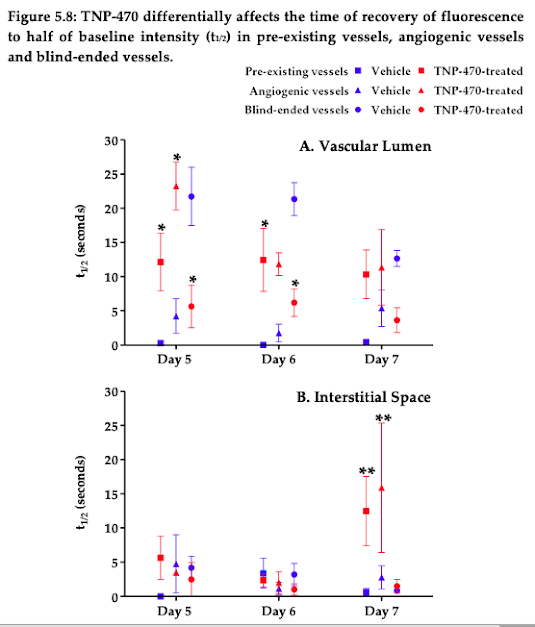
Values plotted are average time
to recovery of half baseline fluorescence intensity (t1/2) ± SEM. t1/2
was calculated individually for the vascular lumen and the adjacent
interstitial space regions of interest for each vessel segment with a 95%
confidence interval (see Methods). In the vehicle-injected animals,
fluorescence intensity recovery is instantaneous in pre-existing vessels,
although it takes longer than 20 seconds to recover to half NFI in BEVs. Within
the vascular lumen (A), TNP-470
injection induces a significantly faster recovery time in BEVs (p<0.05),
whilst significantly delaying the recovery time for pre-existing vessels
(p<0.05). In the interstitial space (B),
there are no significant differences until day 7, when the t1/2
value adjacent to flowing vessels (pre-existing or angiogenic) is significantly
delayed (p<0.01) when compared to vehicle-injected animals. *p<0.05,
**p<0.01.
|
✒ Line graphs are most appropriate in tracking changing values between
variables over a period of time, or when the changing values are
continuous data. 📉📈
 |
|
The
wound area was measured consecutively in each animal (n=11) and varies
significantly over the recorded days (p<0.0001). Wound area, as measured in
non-FITC-dextran perfused region of injury, increases significantly between days
0–3 (p<0.01, **). Wound area decreases most rapidly between days 3–6
(p<0.001, ***). By day 9, non-perfused area within the injury is significantly
smaller than on the injury day (p<0.01, **).
|
✒ When a document contains more than one table or figure, they
should be numbered according to the order in which they are first
mentioned in the main text (Table 1, Table 2, Figure 1, etc).
Special mention: Photos and microscopic images
✒ If complex datasets need to be conveyed, this information can be placed as distinct panels of the same figure, sharing a caption.
✒ Nevertheless, a complete description of what the image depicts, elements essential to how it is read (scale bar), as well as features of note must be present in the caption.
 |
|
Transmission electron micrograph of a capillary within the panniculus
carnosus
from a Balb/c mouse 2 days after contact heat-induced injury. A presumptive
macrophage (M) is adjacent to the
abluminal surface of a capillary, which is demarcated by a basement membrane (white arrows). Two tight junctions are
readily identified (black arrows).
Proximal to one such junction, microvilli (double
arrows) protrude into the lumen (L).
Several small cytoplasmic processes, with abundant pinocytic vesicles (PV), protrude into the lumen. The
endothelial cell nucleus (EN) sits at the base of
a thick cytoplasmic protrusion (Pt),
which may be indicative of intussusceptive capillary growth. This capillary also
contains two erythrocytes (E). Scale
bar = 5 µm.
|
All data adapted from my PhD thesis:
Longitudinal in vivo
characterization of the role of angiogenesis during wound healing
March 2010


Comments
Post a Comment